
Since its debut in 1979, the Russell 2000 index of small-cap companies has broadly kept pace with both the Russell 1000 and S&P 500® indices of larger and mid-cap stocks.
By Erik Norland, Executive Director and Senior Economist, CME Group
However, while small and large-cap companies have delivered similar overall performances over the past four decades, there have been periods of significant variations, including in the first four months of 2020 when small-caps stocks underperformed large-cap companies by nearly 15 percent.
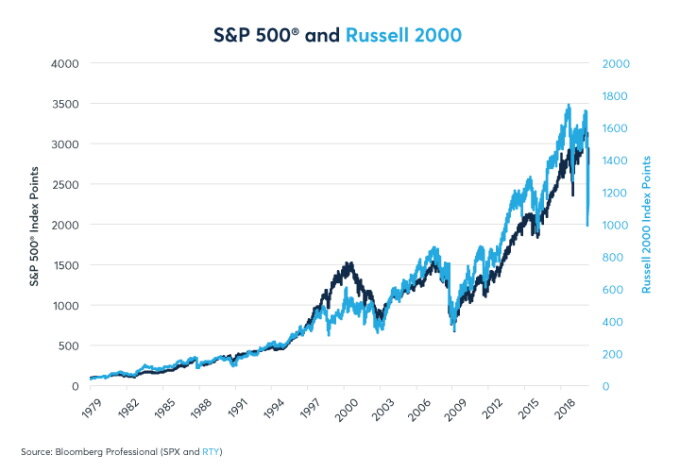
(Figure 1: The S&P 500® and Russell 2000 have delivered similar performances since 1979)
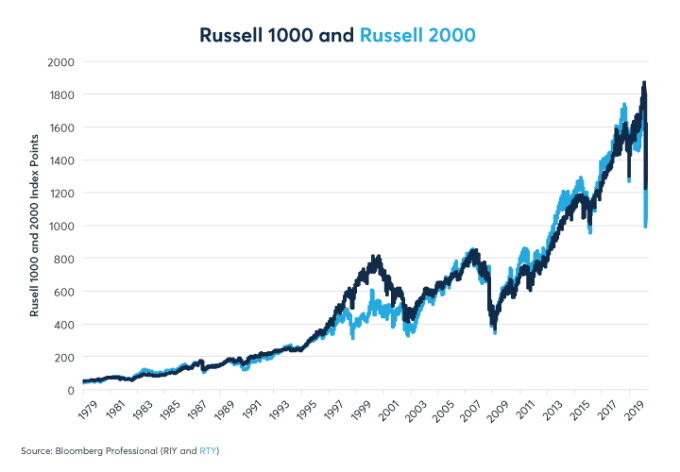
(Figure 2: Russell 1000 and Russell 2000 have had similar overall performances over 41 years)
Prior to 2020, small-cap stocks often outperformed during periods of economic distress (Figure 3):
- 1979-82: During a period of high inflation, significant swings in interest rates and a double-dip recession that took unemployment from 5.5 to 10.8 percent, the Russell 2000 fared better than the S&P 500® by 76 percent.
- 1990-93: Russell 2000 did better than S&P 500® by 48 percent during a period of economic recession and subsequent slow recovery associated with the Savings & Loan crisis and the Persian Gulf War
- 1999-2013: Russell 2000 rose by 114 percent with respect to S&P 500® during a period that featured the ‘tech wreck’ recession of 2001, 9/11, two wars, the global financial crisis and a rather slow economic recovery. There were periodic interruptions in small-cap stocks’ strong performance, especially from 2005 to 2007 when the 2003-07 economic expansion reached it peak.
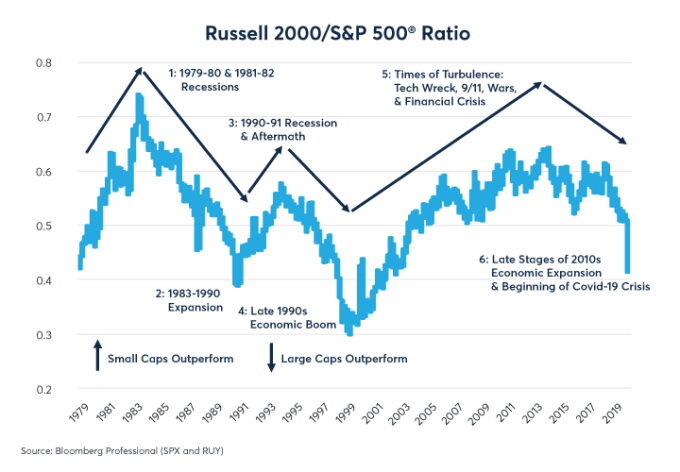
(Figure 3: Small caps have often outperformed large caps during periods of economic stress)
Large-cap stocks have often done better than small-cap companies during economic expansions. In addition to their brief outperformance in the late stages of the 2003-07 expansion, they had more stellar performances during three notable episodes:
- 1983-90: during the 1980s boom, S&P 500® outperformed Russell 2000 by 91 percent
- 1994-99: during the 1990s expansion, S&P 500® outperformed Russell 2000 by 92 percent
- 2013-20: In the later stages of the 2010s recovery, S&P 500® outperformed Russell 2000 by 29 percent through the end of December 2019 and then outperformed by an additional 20 percent during the first three months of 2020.
A very similar performance pattern exists between the Russell 2000 and its sister index, the Russell 1000, which has a high degree of overlap with the S&P 500® (Figure 4). What is curious is why have small-caps stocks sharply lagged large-cap stocks so far in 2020, when they have typically done better during past periods of economic change and distress?
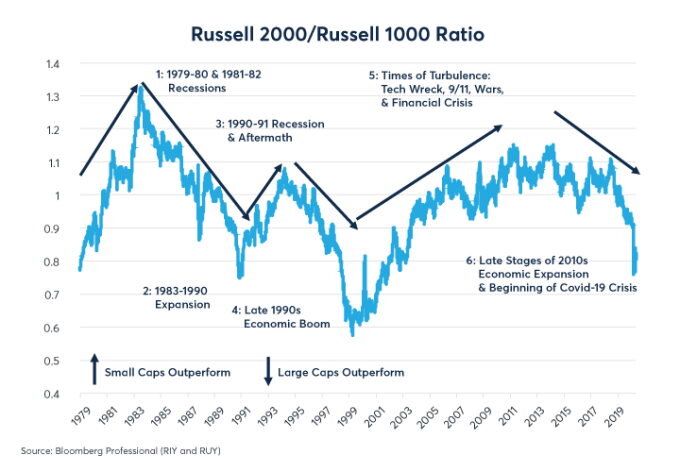
(Figure 4: Large caps have often outperformed small caps during periods of economic expansion)
One hypothesis is tied to their very different sector weightings. Compared to the Russell 1000 mid-and-large cap index, the Russell 2000 has a much lower weight to technology stocks (12.4 percent versus 23.5 percent). Likewise, the Russell 2000 has lower weight for both consumer discretionary and consumer staples shares. Simultaneously, it has higher weight to financial services, health care, materials and industrial stocks (called «producer durables» at Russell). Other sectors have similar weightings between the two indices (Figure 5).
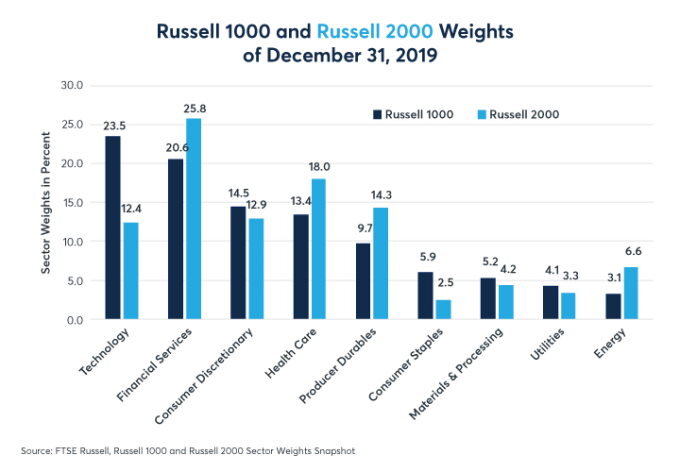
(Figure 5: Small caps have a higher weight to health care and financial services and a lower weight to IT)
As it turns out, the differing industry weightings explain almost none of the reasons why small caps have underperformed. If one applies the weightings of the Russell 1000 index to the sectors of the Russell 2000 and calculates a hypothetical performance of a Russell 2000 index that had the same sector weightings as the Russell 1000 index, the hypothetical Russell 2000 with Russell 1000 sector weightings has a nearly identical performance (Figure 6).
In other words, the differences in sector weightings explain only a small portion (about 10 percent) of the underperformance of small-caps stocks vis-à-vis large-cap stocks during the first four months of 2020.
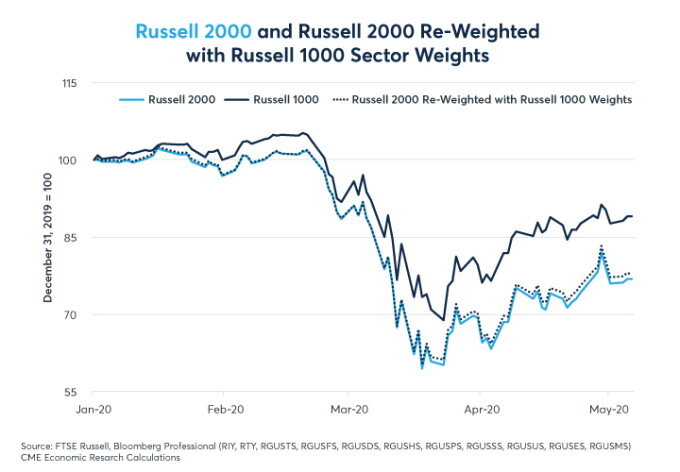
(Figure 6: Sector weightings differences between Russell 1000 & 2000 don’t explain performance gap)
In fact, across Russell’s industry categories, small-caps stocks have underperformed during the year to May 5 in eight of the nine sectors. Only in utilities have they outperformed, and even there only by 0.9 percent. In every other sector, small caps have underperformed mid and large-cap stocks and sometimes by substantial amounts: a 37 percent gap in consumer discretionary, 12 percent in technology and 10 percent in financial services (Figure 7).
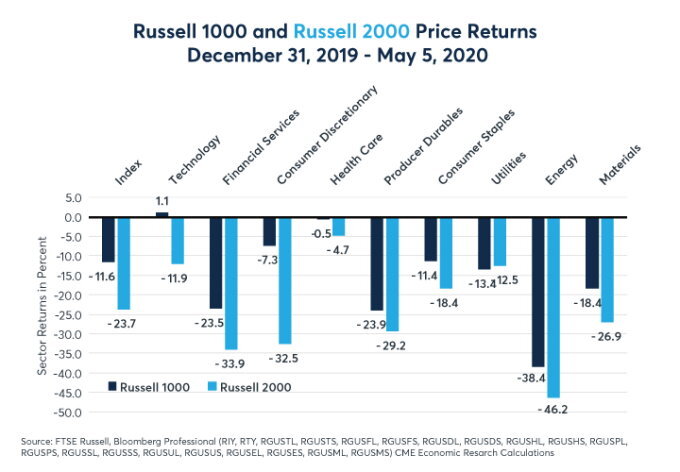
(Figure 7: The Russell 2000 has underperformed in eight of nine industry categories)
Given that small caps have been harder hit across nearly every industry category than their larger peers up to May 5, 2020, the question is why? Are smaller companies more impacted by the closing of parts of the economy than their larger peers? Or, have their stocks reacted negatively to specific market factors such as rising volatility, moves in oil prices or interest rates?
To answer these questions, we regressed the difference in daily price return between the Russell 2000 and Russell 1000 on four factors:
- Daily changes in the VIX index of volatility on S&P 500® options
- Daily changes in WTI crude oil prices (front month contract rolled 10 days prior to expiry)
- Daily changes in the 2Y government bond yield
- Daily changes in the 2Y-10Y yield curve
On days when the VIX index rose, large caps tended to do better and vice versa. A one-point rise in the VIX index translated, on average, into a seven-basis-point underperformance of the Russell 2000 with respect to the Russell 1000. That might not sound like much but the VIX rose from 14 to 85, enough to shave as much as 4.5 percent off the Russell 2000 vis-à-vis the Russell 1000, according to our model.
This suggests that when stocks fell between February 19 and March 23, small caps fared poorer perhaps because they are not as liquid, on average, as their larger peers and their prices had to fall further in order to attract buyers. That said, small caps haven’t closed the gap with large caps since the market’s low in March even as the VIX retreated from its peak at around 85 to as low as 31 by early May.
The interest-rate factor explains only a small portion of the variance between the Russell 2000 small caps and larger-cap stocks in the Russell 1000. Small caps appear to benefit slightly more from the decline in interest rates.
Overall, however, our regression explains only about 10% of why small-caps stocks lagged their larger peers. That, together with the differences in sector weightings, leaves 80 percent unexplained. This leads us to the conclusion that small-caps stocks are, on the whole, much harder hit by the COVID-19 crisis and associated lockdowns than their larger peers.
In financial markets, the past is not necessarily prologued. Indeed, during past periods of economic distress, smaller firms proved nimbler at navigating economic crises and the early stages of recoveries. This was the case following each of the past three downturns in 1990, 2001 and 2008-09. However, the current pandemic is very different from past situations, as an exogenous shock to the economy and humanitarian crisis has led to a sudden drop in economic activity.
The previous three downturns were endogenous, caused by financial imbalances and, arguably, overly tight monetary policies in the periods preceding the downturn. Those downturns took place over months and years, not weeks, giving firms of all sizes more time to adapt. As such, it remains to be seen whether smaller firms can do better than their larger peers during the coming recovery.
Erik Norland is Executive Director and Senior Economist of CME Group. He is responsible for generating economic analysis on global financial markets by identifying emerging trends, evaluating economic factors and forecasting their impact on CME Group and the company’s business strategy, and upon those who trade in its various markets. He is also one of CME Group’s spokespeople on global economic, financial and geopolitical conditions.