In late February and early March 2020, global markets experienced an unprecedented health crisis which increased both economic uncertainty and market volatility.
Leading up to the crisis, quarterly economic growth forecasts for the remainder of the year were between 1 to 4 percent. Now we are seeing forecasts of -20 to -34 percent in the second quarter alone. The crisis and the rapid change in expectations have created the highest level of economic uncertainty in decades.
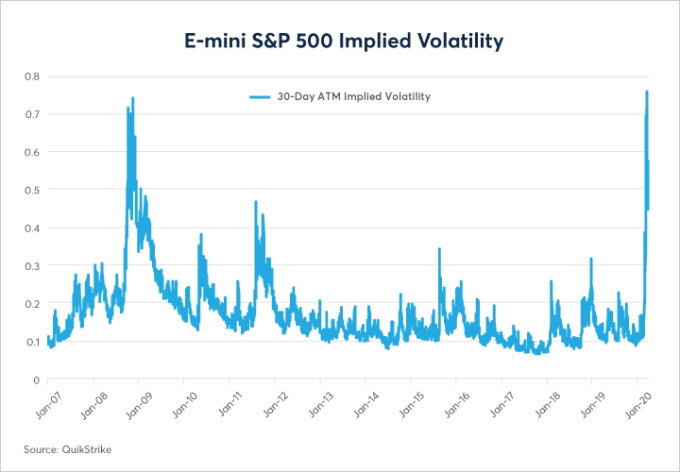
This situation caused the largest spike in volatility since the financial crisis of 2008-9. Implied volatility on the E-mini S&P 500, shown below, which can be viewed as a proxy for broader market volatility, surged to the highest level in more than 13 years in early March amid the spread of COVID-19.
Increased volatility should, all other things being equal, cause wider bid/offer spreads and lower book depth in all markets as market participants wisely reduce risk-taking due to the increased value at risk from higher volatility.
Given the capital and risk limits of a typical participant, resting order book liquidity declines because of both the higher velocity of price changes and the wider breadth of price ranges across which the resting order book is stretched.
Volatility Spikes
As this occurs, resting order book liquidity tends to be replaced, at least partially, by refreshed liquidity. Therefore, the facilitation of risk transfer at a trading platform as measured by volume becomes one of the core liquidity metrics during periods of increased volatility. When volatility spikes, it is typical to see CME Group futures volumes surge with it.
When analyzing this situation, rather than focus on any one metric individually (such as the top of book depth), analysis into market liquidity should consider three interconnected metrics: market conditions, demand, and supply.
Three Factors
How are these three fundamental factors linked? As risk increases (a market condition), market participants must reduce order sizes (supply) to maintain proper risk controls; at the same time, there is more demand from other participants for hedging, so volume (demand) increases.
These three fundamental factors of liquidity are intrinsically linked and will adjust to remain in balance. Analyzing these three factors together provides a holistic perspective versus analyzing any one of the factors without the context of the other two. As with all analysis, the conclusions must be handicapped, but this analysis does tell a somewhat different story than purely looking at bid/offer spreads and depth of book in isolation.
Understanding the Balance
To appropriately represent the interplay of how these three crucial measures impact liquidity, CME Group has introduced new holistic liquidity metrics to represent the environment facing traders as they seek to execute trades in highly volatile markets.
These measures, which represent some traditional liquidity measures in relation to true market conditions, provide a more comprehensive view of liquidity than some of the more commonly used statistics.
Holistic Liquidity Metrics
The holistic liquidity metrics are used to provide more context to market conditions than traditional liquidity metrics. These figures, taken together, demonstrate how liquidity and the cost-to-trade (CTT) are impacted by changing market dynamics and increased demand as measured by volume throughput of the order book. Using basic economic tenets, this analysis considers:
- Market conditions (daily true range)
- Supply (cost-to-trade in the contract)
- Demand (volume in the contract)
Cost-to-trade is calculated on a sizeable-lot size for each benchmark product.1 Rather than focus on only a single data point, our analysis shows the ratio of cost-to-trade over the daily true range, showing how far markets move during these volatile periods relative to cost-to-trade.
To analyze the extreme volatility experienced during late February and into March 2020, CME Group considered these holistic data points for the period of initial stress, February 24 – March 13, presented in more detail below. During this volatile period, cost-to-trade did increase on an absolute basis, as is expected given the speed and severity of the market changes.
Dramatic Increase
However, in every instance, this increase was smaller than the dramatic increase observed in the daily trading range and average daily volumes; so on a relative basis, cost-to-trade declined in relation to the increase in the daily trading ranges.
This illustrates the strength and resiliency of CME Group’s markets during times of crisis, allowing traders to execute significant-lot sizes with moderate increases in cost, in the face of far more dramatic swings across other market variables.
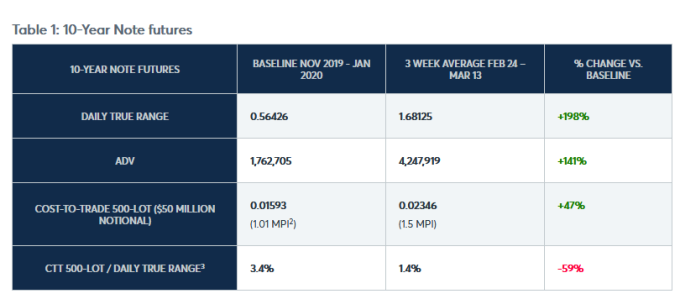
Treasury Futures Holistic Liquidity Metrics
The 10-Year U.S. Treasury is the traditional destination for «flight to quality» during times of economic distress and uncertainty, with CBOT 10-Year Note futures as one of the most liquid instruments available for exposure to high-quality fixed income.
As such, while the 10Y contract does experience increased price movement alongside other financial products, its depth of market remains robust even in choppy trade. The table below shows that while the daily true range for the three weeks of extreme volatility (February 24 – March 13) increased by nearly 200 percent, cost-to-trade on a 500-lot trade ($50 million notional value) increased by less than a quarter of that, growing by 47 percent for the baseline period of November 2019 – January 2020.